enVision Process Visibility System
Digitalize Any PLC Driven Process with Sinto’s IIoT Platform – ePVS
Digitize and optimize your system by visualizing every device, motion and event to generate clear ACTIONABLE solutions for optium productivity and efficiency. 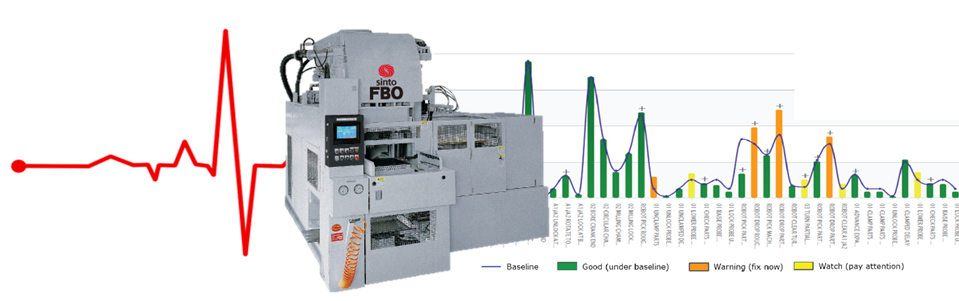 Like an EKG on a human heart, enVision Process Visibility System (ePVS) captures and records every motion or event of the system.
OPTIMIZATION MADE SIMPLE
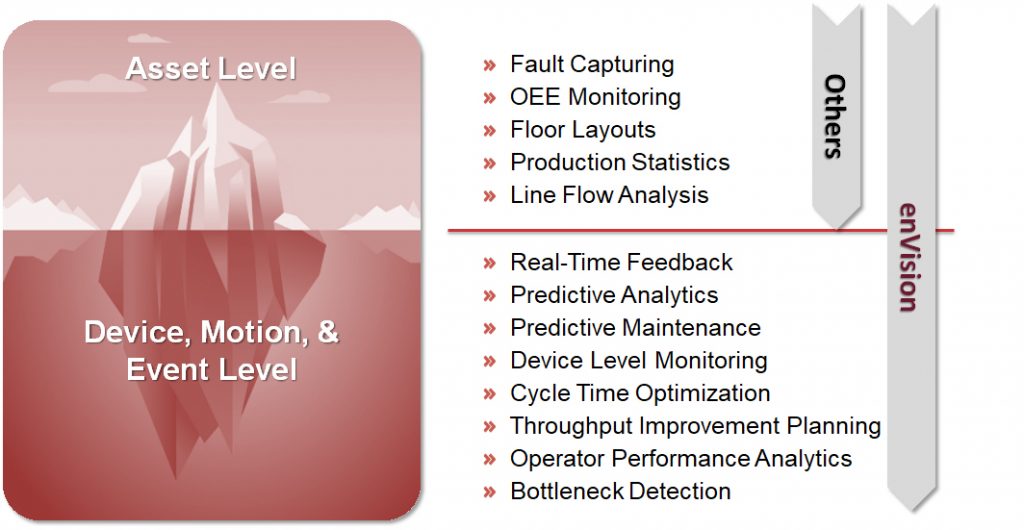
enVision Process Visibility System (ePVS) is a one-of-a-kind data acquisition and process visualization system designed to help manufacturers reach new heights of optimization. Envision makes it easy to see what’s happening now, what will happen soon, and what should be done to make the most of your production potential.

GAIN BETTER VISIBILITY
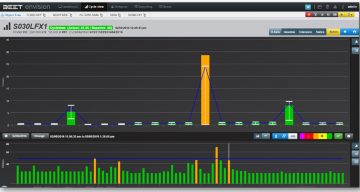
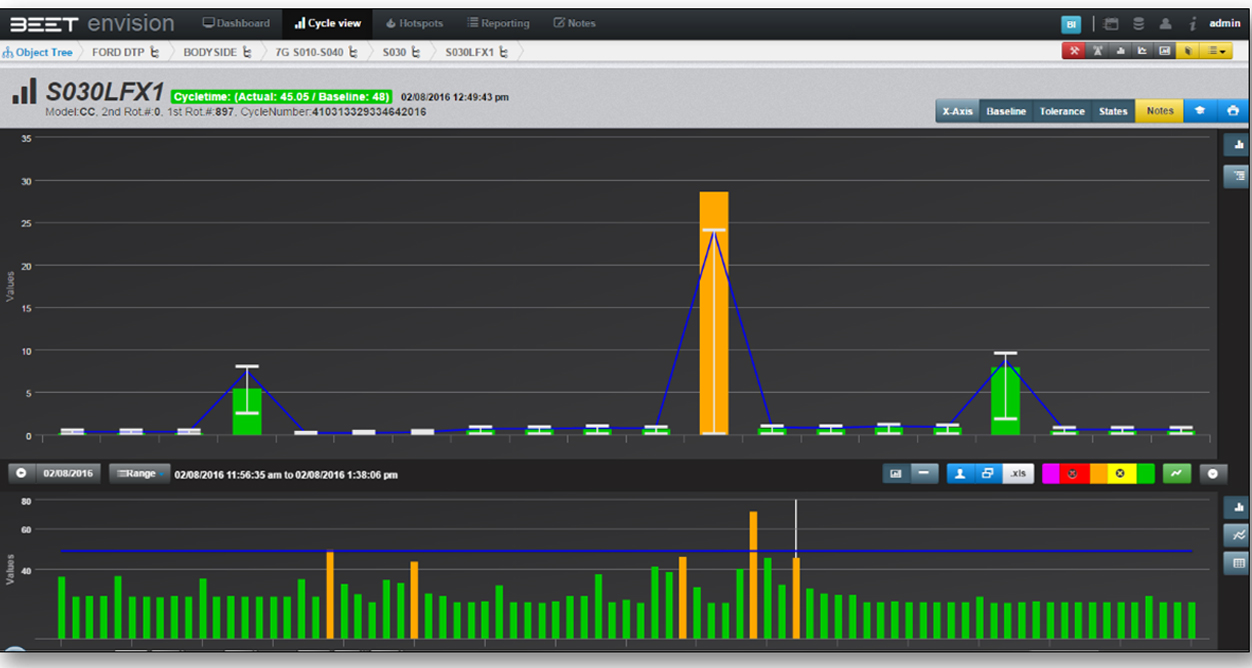
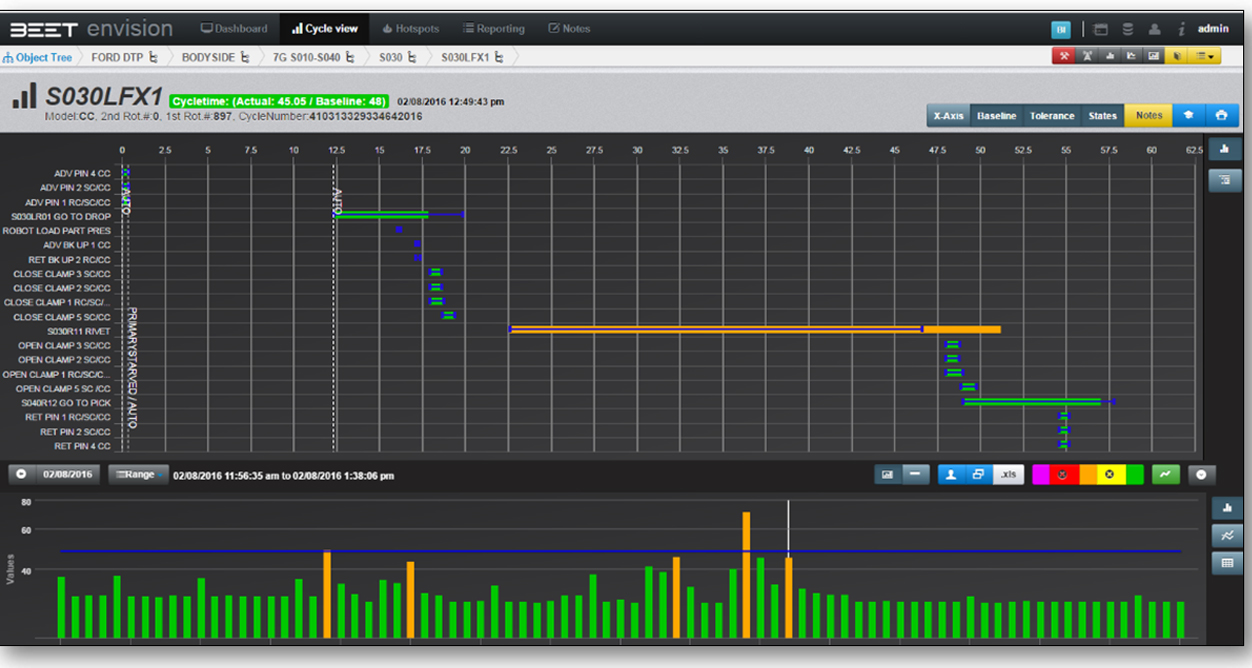
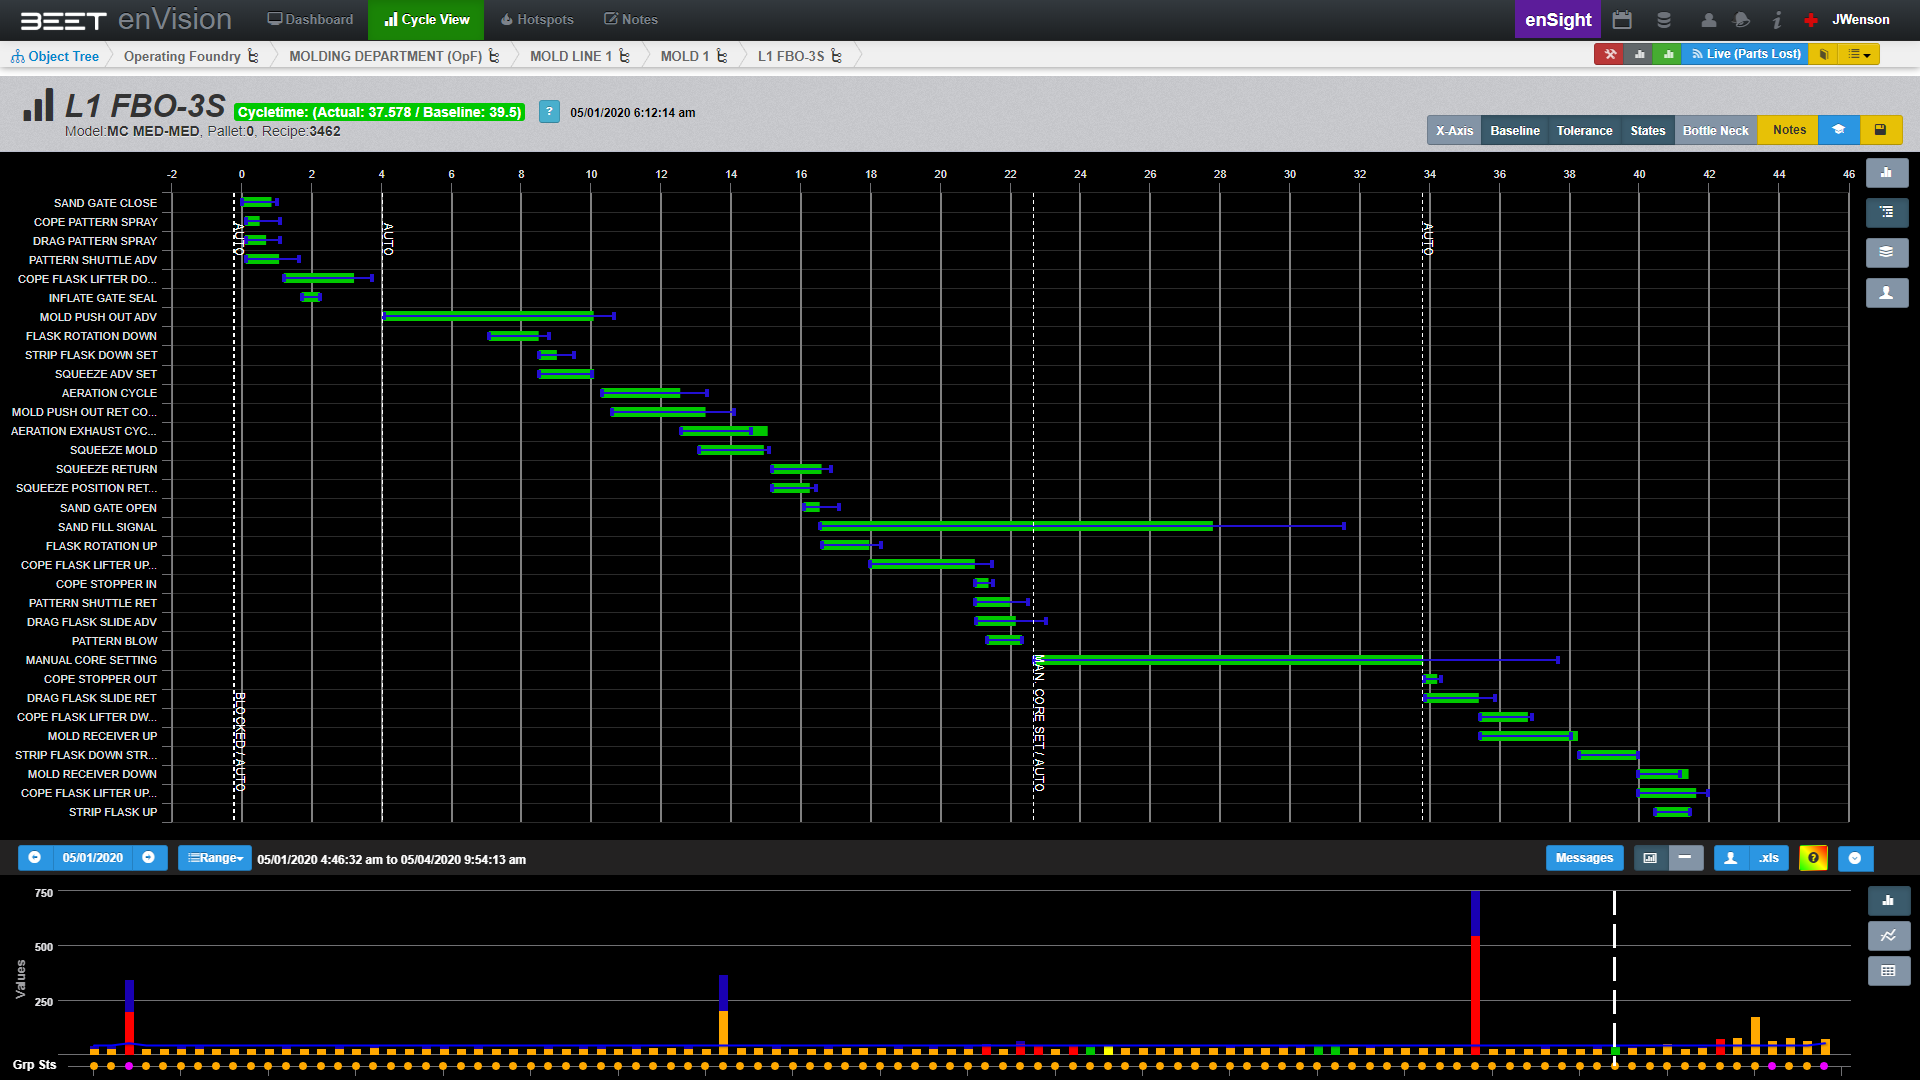
ePVS make’s it easy for any member of your team to quickly assess performance, make decisions and take immediate action by providing provides more data, more accurately, more intuitively. Unique visual display uses Gantt style charts and a simple color-coding system to represent actual versus allocated cycle-time for each component. No stopwatches. No guessing. No time wasted.

PREVENT UNPLANNED DOWNTIME
Envision’s process visualization system is the only solution on the market that provides real-time degeneration data, allowing your team to see and address problems BEFORE a fault occurs for a significant reduction in unplanned downtime. Envision also makes it easy to correlate data and identify patterns over longer periods of time, so you can predict when recurring maintenance will be necessary, and replace your default maintenance schedule with one based on real, reliable data.

REVEAL HIDDEN CAPACITY
Envision’s detailed visual data helps you bring lag times, production gaps and unused assets to light, revealing inefficiencies and opportunities for meaningful optimization that would otherwise remain hidden. Our system paints a clear picture of how, when and where throughput can be increased, and how maximum production can be achieved.
Why choose ePVS?
See Sinto’s Remote Monitoring Sensors here.
How It Works
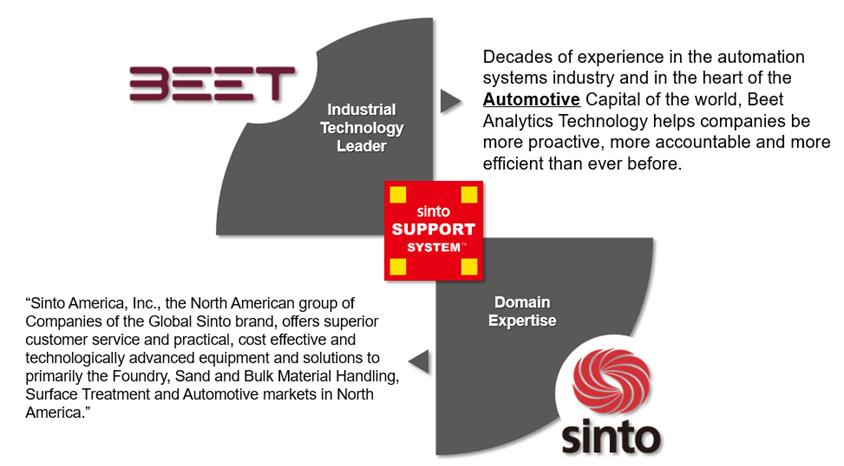
Sinto America and BEET Analytics Technology Partnership:
BEET Analytics Technology- Envision Introduction
ePVS Key Benefits
 ➡ Easy interpretation
➡ Immediate action
➡ Total Process Viability
➡ Digitize and visualize every device, motion and event
➡ Build your industry 4.0 foundation
➡ Any PLC driven machine
➡ Flexible and scalable cloud-based solution
➡ Secure one-way data feed
➡ Continuous development
➡Simple visual and immediate feedback
➡ Customizable reporting
➡ Automatic alerts and notifications
➡ Remote monitoring
➡ 17 awarded patents for data collection and handling
➡ Integration with existing platforms
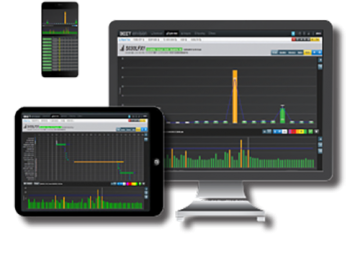
Live Production Monitoring
The data gathered can be fed back real-time to production line-side monitors, completely customizable to the information the operators, shift leads, or plant managers need to see.
Line Side Production Counts and Targets:
Use this view to help the operator see what his goal is and how close they are to being on target. You can also see the last shift, for those competitive workers out there!

Entire Department or Facility Visual Monitoring:
Use this view to visually see the current state of the machines on the floor, by highlighting it in different colors, making it easy to see how everything is operating at a glance

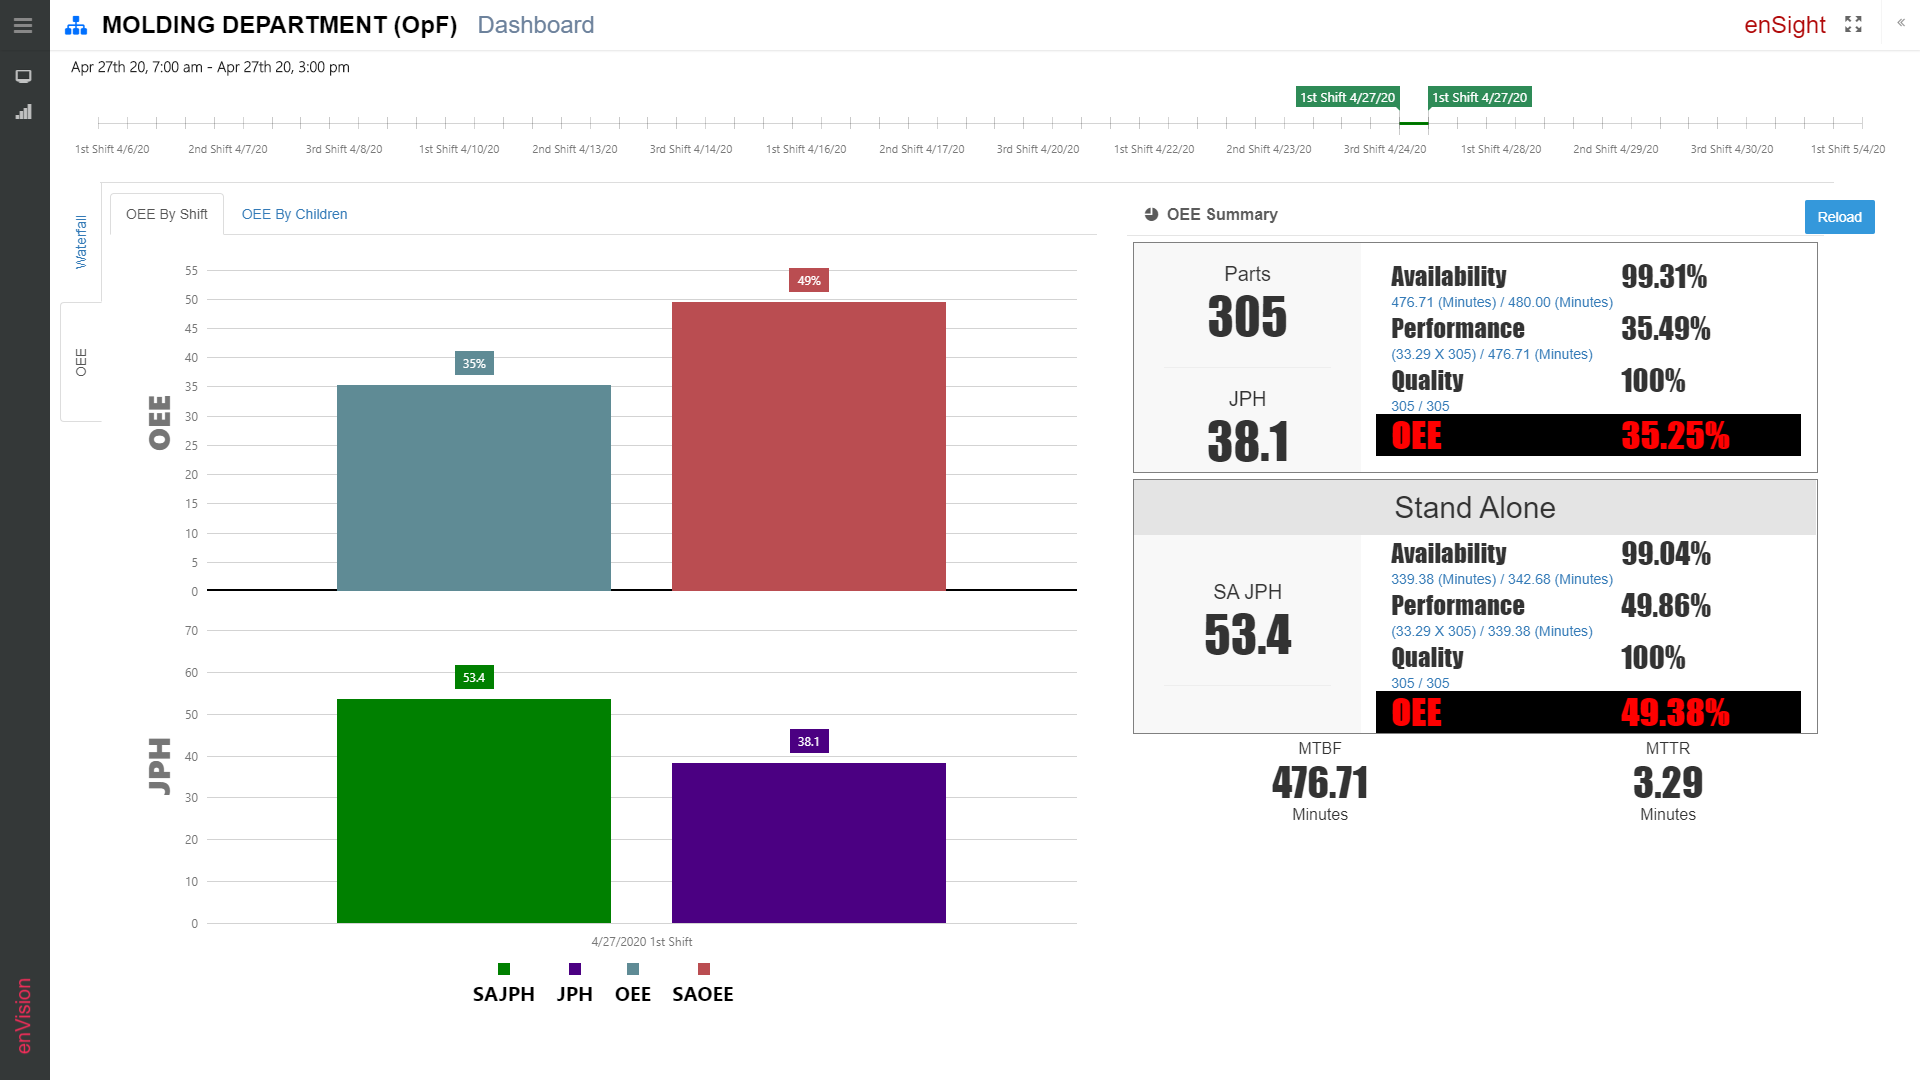
OEE- Overall Equipment Efficiency Monitoring:
Use this view to: understand the effectiveness of your production floor
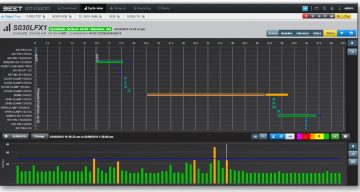
Cycle Time View- Sequential Operations:
Use this view to: Easily visualize how your equipment is operating, down to each motion that a machine makes
Customizable Dashboards
Easily configurable dashboards help you organize your data to gain insights into your operation and can be targeted to the intended audience, from management to maintenance.
<hr />
<h5>Downtime Analysis:</h5>
<a href=”https://sintoamerica.com/wp-content/uploads/2020/04/ePVS-Downtime-Analysis-Dashboard.png”><img class=”aligncenter wp-image-9640 size-large” src=”https://sintoamerica.com/wp-content/uploads/2020/04/ePVS-Shift-Performance-Dashboard-1024×576.png” alt=”” width=”640″ height=”360″ /></a>
<hr />
<h5>Shift Performance:</h5>
<a href=”https://sintoamerica.com/wp-content/uploads/2020/04/ePVS-Shift-Performance-Dashboard-1.png”><img class=”aligncenter wp-image-9656 size-large” src=”https://sintoamerica.com/wp-content/uploads/2020/04/ePVS-Shift-Performance-Dashboard-1-1024×576.png” alt=”” width=”640″ height=”360″ /></a>
<hr />
<h5>Performance:</h5>
<a href=”https://sintoamerica.com/wp-content/uploads/2020/04/ePVS-Performance-Dashboard-1.png” rel=”attachment wp-att-9662″><img class=”aligncenter wp-image-9662 size-large” src=”https://sintoamerica.com/wp-content/uploads/2020/04/ePVS-Performance-Dashboard-1-1024×576.png” alt=”” width=”640″ height=”360″ /></a>
<hr />
<h5>Individual Motion Cycle Time Analysis:</h5>
<h5><a href=”https://sintoamerica.com/wp-content/uploads/2020/04/ePVS-Individual-Motion-Cycle-Time-Analysis-Dashboard.png”><img class=”aligncenter wp-image-9658 size-large” src=”https://sintoamerica.com/wp-content/uploads/2020/04/ePVS-Individual-Motion-Cycle-Time-Analysis-Dashboard-1024×576.png” alt=”” width=”640″ height=”360″ /></a></h5>
<hr />
<h5>Detailed Individual Motion Cycle Time Analysis:</h5>
<h5><a href=”https://sintoamerica.com/wp-content/uploads/2020/04/ePVS-Detailed-Individual-Motion-Cycle-Time-Analysis-Dashboard-1.png”><img class=”aligncenter wp-image-9660 size-large” style=”font-size: 16px;” src=”https://sintoamerica.com/wp-content/uploads/2020/04/ePVS-Detailed-Individual-Motion-Cycle-Time-Analysis-Dashboard-1-1024×576.png” alt=”” width=”640″ height=”360″ /></a></h5>
<hr />
<h5>Maintenance:</h5>
<a href=”https://sintoamerica.com/wp-content/uploads/2020/04/ePVS-Maintenance-Dashboard-1.png”><img class=”aligncenter wp-image-9664 size-large” src=”https://sintoamerica.com/wp-content/uploads/2020/04/ePVS-Maintenance-Dashboard-1-1024×576.png” alt=”” width=”640″ height=”360″ /></a>
<hr />
FAQ
Common Questions:
1. What does a factory version of your enVision software cost?
➡ The system is scalable. Cost is based on a subscription model and on how many motions and events are monitored. Typically, we do a pilot project with the customer to review the tool live within your process. This way you see the value first hand and that an ROI is always less than six months.
2.What does your enVision software license fee?
➡The fee is based on Software-as-a-Service (SaaS) license model. A yearly subscription fee will be charged based on the number of motions and events monitored.
3.Are there additional charges for other support?
➡Support is included in the SaaS model. All software updates and technical support are included.
4.Is there an additional cost for drivers or other communications? For example, specific PLC types, databases or reporting tools?
➡As we utilize the cloud for computing there are minimal onsite requirements. We do need an onsite enVision Data Collector Appliance (EDCA / industrial computer) that would mount in a control panel. One EDCA can handle up to 20 PLC’s and approximately 5,000 motions on one subnet.
5.How many hours does it normally take to set up enVision per machine?
➡We create the driver offsite and time to create is based on the number of motions and events and the size of the production system. When we are onsite installing, it is approximately five to ten minutes per PLC. We can work with any PLC as long as there is an ethernet connection and the ability to get the data to the EDCA.
6.What about Security? Does data flow bi-directionally with enVision?
➡Data is a one-way push to the cloud and the system is web-based for viewing with authorizations. enVision only has read permissions, no write permissions.
7.Has Envision ever been used for any other purpose other than time analysis? If so what?
➡enVision can positively impact launch, daily production and maintenance:
i. New Launch of any Critical Application
> Line traceability and system supplier held accountable (Customer has visibility to keep supplier onsite till line meets performance criteria on each device)
> System integration support until lines run as intended
> 25% reduction in launch curve (based on new launch)
ii.Existing Line
> 1.5% EE improvement (minimum)
> 2.75% reduction in time to identify, solve and validate problems
> Predictive maintenance; predict and prevent at least 50% of the downtime
> enVision will guarantee a 3% minimum in throughput efficiency opportunities
➡ Customers utilize enVision as an ability to link quality issues to device level detail.
➡ enSight is our FIS system for production line monitoring.
8.What other products are being developed to integrate with Envision?
We are an open source product so we are working with some customers on integration into their existing systems.
9.What do you charge for an hour of engineering time?
NRE is charged as a one-time charge per area and number of motions and events.
10.What OEM products does enVision integrate with?
Examples: Wonderware, RSvView, Cimplicity We can plan to discuss anything that you want to integrate with.
Videos
<h5 class=”title style-scope ytd-video-primary-info-renderer”>Sinto Analytics on FDNX Flaskless Molding Machine- CastExpo 2019</h5>
<hr />
<h5 class=”title style-scope ytd-video-primary-info-renderer”>Sinto America Industry 4.0 Foundry Analytics (IoT) Software</h5>
<hr />
<h5 class=”title style-scope ytd-video-primary-info-renderer”>Sinto America and Industry 4.0 Webinar</h5>
Request More Info
Please fill out the form below if you would like to be sent more information on Sinto’s Remote Monitoring Sensors